Executive Summary
This report explores how Lyft can leverage Uber’s public twitter data to build marketing strategies. As the two largest private taxi service providers, competition is fierce and data analytics is key as a competitive advantage. Therefore, I probe the possibility and exploiting Uber’s public data and leveraging it as Lyft’s strength. The following section explains the research objectives in exploring public twitter data and outlining the key success metrics. Secondly, I’ll review the research plan and methodology. This part is vital in ensuring high-quality quantitative data for analysis. Next, I’ll assess the data findings. This is the core section of this research project, which will validate the plan and methodology. It will determine if the endeavor of utilizing public twitter data to aid the marketing strategy process is credible. Finally, if my research and experiment are successful, I will recommend marketing strategies based on my data findings.
Research Objective
Research question: How can Lyft use twitter sentiment analysis and geolocation to understand what Uber’s customers are saying and build a marketing strategy in specific geographic areas? For example, what are New York City customers saying on twitter about Uber? If there are negative sentiments, how can Lyft use them to build marketing strategies in New York City to acquire these Uber followers or customers?
The objective is to determine if Lyft can leverage Uber’s negative public twitter data and build marketing strategies based on the findings. Our goal is to use Uber’s weaknesses as Lyft strengths. Moreover, understand Uber’s customer base, learn what makes them tick and see what other findings I can utilize in Lyft’s marketing endeavors. This methodology is one tool for building marketing strategies, if proven successful it should still be considered along with other marketing tools and never used as a stand-alone strategy. Furthermore, this research should allow me to build strategies to acquire Uber customers who experience similar frustrations. Based on the findings, I should be able to find patterns of behavior and frustrations of Uber customers/followers. Therefore, allowing me to approach them with a solution to their problem by using our services. This research will also allow me to compare what commonalities of differences from experiences Lyft customers face.
Success Metrics
To provide Lyft with successful marketing strategies, I must obtain a large sample size of tweets from New York City. This sample size should reflect a good number of negative tweets, which will allow me to build a robust marketing strategy and successfully target frustrated Uber customers/followers. The analysis should provide a cluster of similar information, which will be the key metric for a recommended marketing strategy.
Research plan and methodology
The core of the research plan and methodology is focused on utilizing R and the twitteR package by Jeff Gentry to download the dataset of tweets (twitteR package doc: https://cran.r-project.org/web/packages/twitteR/twitteR.pdf). Moreover, the twitteR package connects to the twitter API for downloading tweets (for more information on the twitter API look here: (https://dev.twitter.com/overview/api). The objective is to collect a minimum of 100,000 tweets containing @uber or #uber. However, the tweets collected, not all will be from New York City, they will contain retweets and will not have a sentiment analysis score attached to each tweet. Therefore, by utilizing R, I will clean up the dataset to only assess the tweets from New York City with a negative sentiment, not including retweets. To conduct the sentiment analysis, I will use Minqing Hu and Bing Liu opinion-lexicon library. This library contains two .txt files, one with positive keywords and another with negative keywords. I will run my tweet text through these two files to obtain a sentiment analysis score. Negative sentiments scores will have a negative numeric value and positive scores will have a positive numeric value.
These are the steps I will take using R to clean up the data. The outcome will be negative sentiment tweets (not including retweets) from New York City. Data clean-up process leveraging R to clean up includes:
Remove retweets. Remove tweets which don’t have a New York City location. Use Minqing Hu and Bing Liu opinion-lexicon library to categorize New York City tweets in 3 categories: neutral, positive and negative. Use R to analyze negative sentiment tweets from New York City.
Data findings and cleanup
I collected 136,615 tweets between March 21st, 2017 and April 16th, 2017; each tweet contains these attributes:
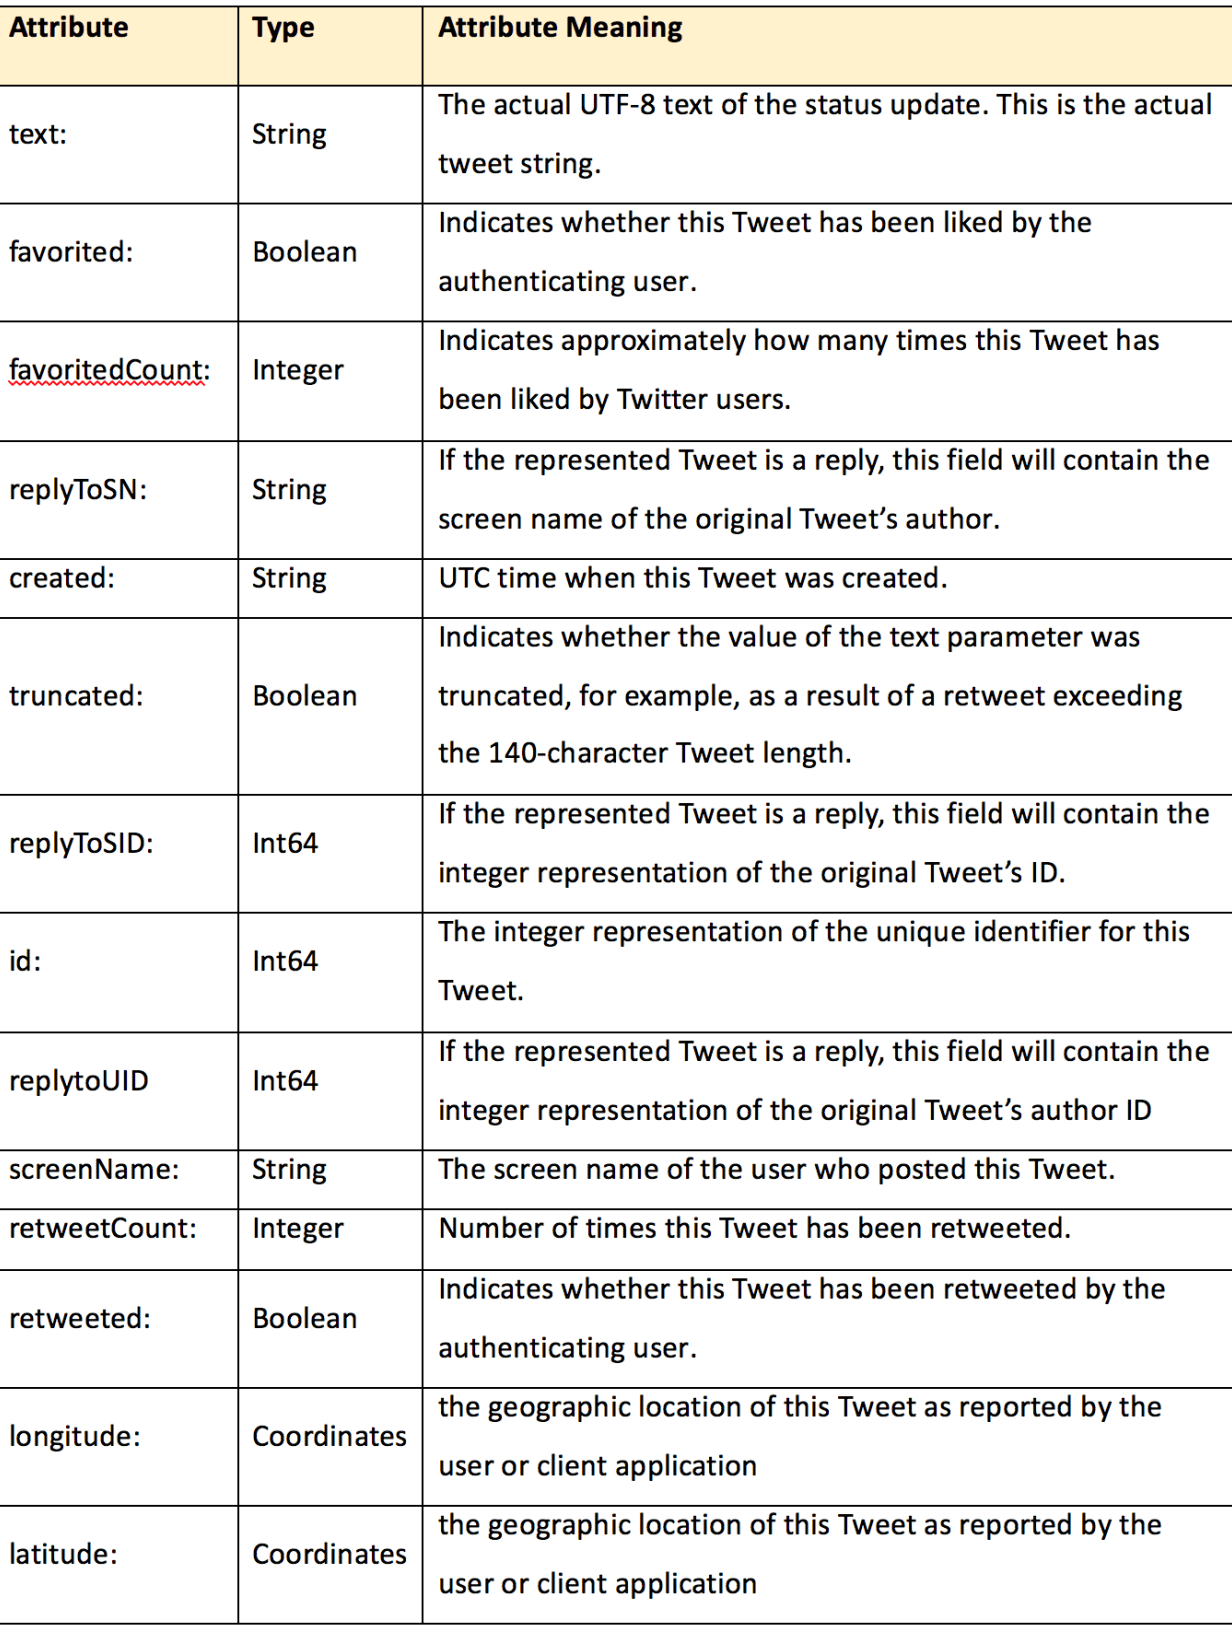
However, not all attributes are necessary for my analysis. Therefore, only these attributes were analyzed: text, favoriteCount, created, ScreenName, retweetCount, longitude and latitude.
One of the issues I encountered was a large amount of missing latitude and longitude values. When users send a new tweet, they must have location enabled on their tweet for me to get the latitude and longitude values once downloaded, which was not a common practice amount the 136,615 tweets I collected. Therefore, I used the Google Maps Geocode API to find user location based on screenName. Moreover, I could attribute tweet location based on user profile location.
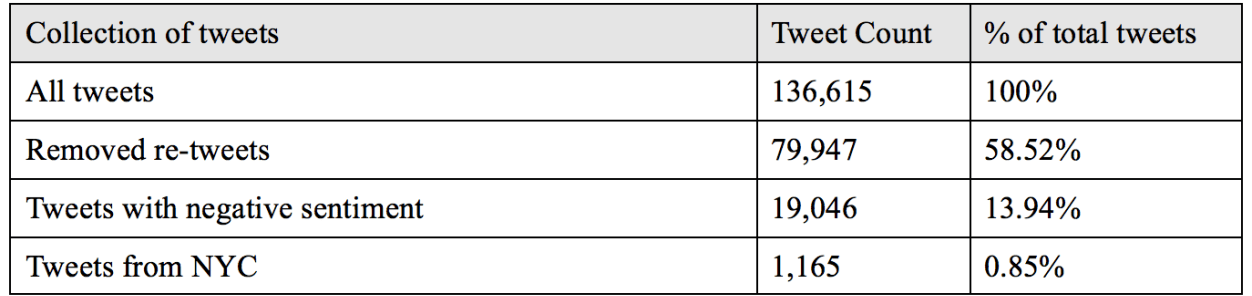
After removing all retweets, I was left with 79,947 tweets (58.52%) of the original 136,615 tweets. Next, I ran a sentiment analysis to determine which tweets had a neutral, negative and positive sentiment. This left us with 19,046 (13.94%) tweets with a negative sentiment value. Finally, I used Google Maps Geocoding API (more info here: https://developers.google.com/maps/documentation/geocoding/intro) to geocode all negative sentiment tweets. Additionally, from this list I filter out all the New York City tweets, this left me with 1,165 negative sentiment tweets (0.85% of total collection). Final data cleanup output includes 1,165 tweets of the 136,615 tweets. Finally, I now have all New York City location tweets, which are not retweeted and have a negative sentiment value. The next step is data analysis and looking for patters and consumer behaviors to help Lyft build marketing strategies.
Data analysis – Negative Tweets
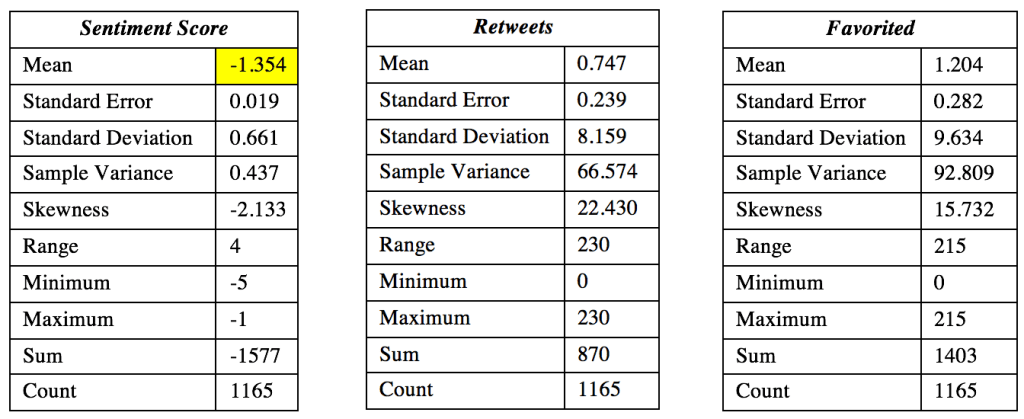
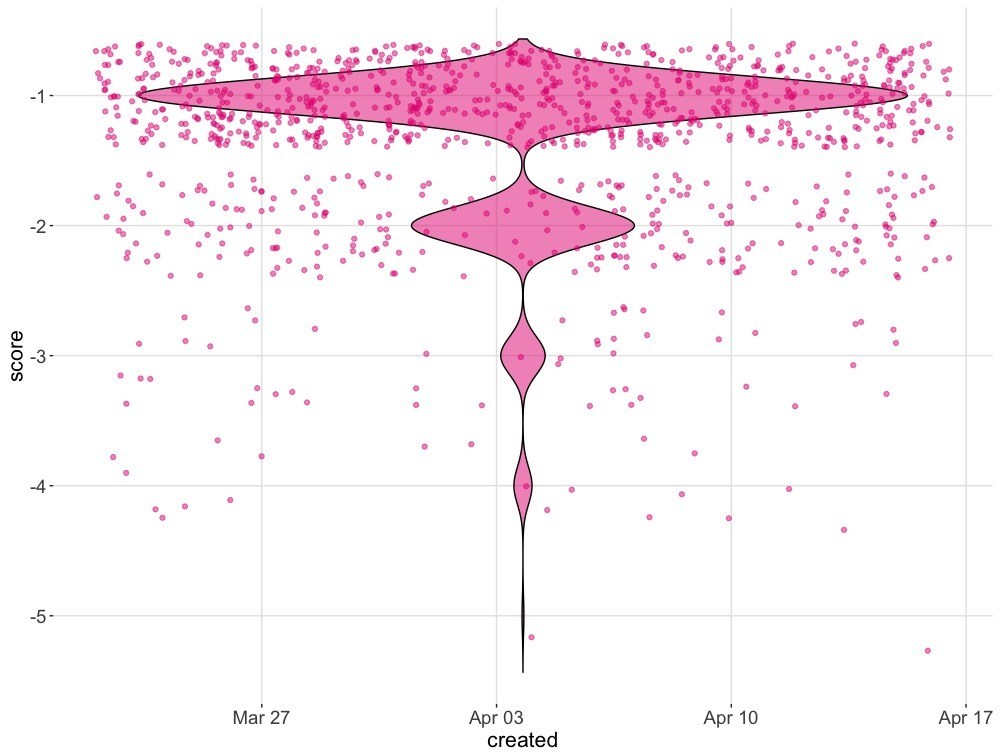
In this portion of the analysis we look at descriptive statistics for sentiment score, retweets, favorited and truncated data from tweets. From the filtered down dataset, all sentiment scores have a negative value since they are only negative sentiment tweets. All negative tweets have an average sentiment score of –1.35. Moreover, tweets were favorited an average of 1.2 times and retweeted an average of 0.7 times.
Additionally, here is a visual plot displaying the sentiment score by date of tweets. It is an even distribution of tweets over time. Moreover, keep in mind that range is –5 (very bad) to –1 (not so bad).
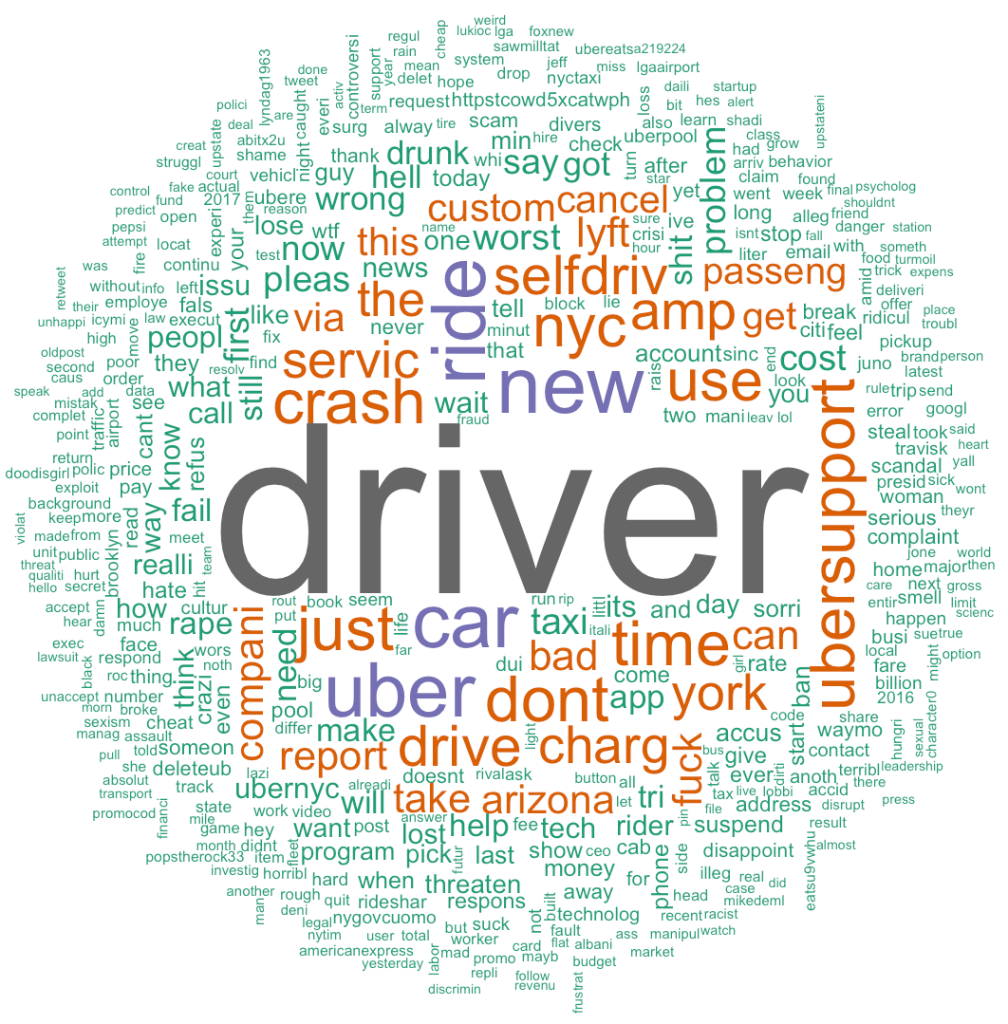
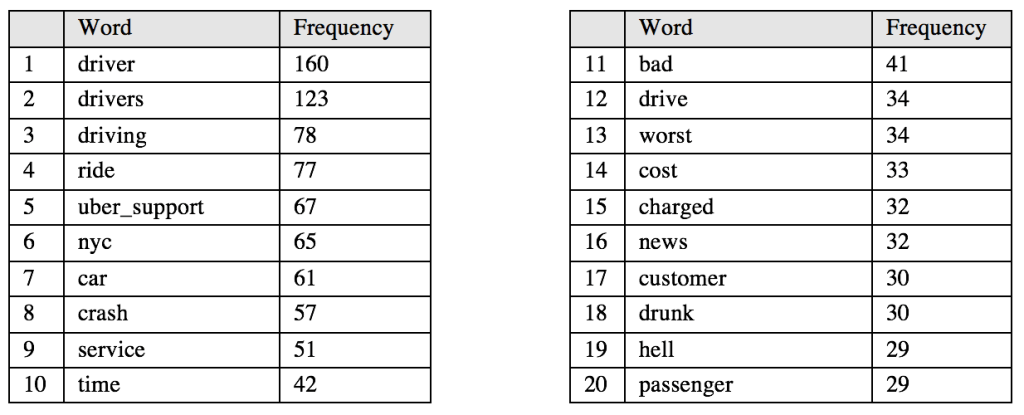
Through a word cloud we conduct further analysis into the text with most frequent words appearing in the negative tweets dataset. Visually, we can identify the most common word used in the negative tweets is ‘driver’. This leads me to believe that followers (customers) are having issues with Uber drivers. In the section, I’ll go into a further analysis of the most frequent words by day. Other noticeable words include: crash, ubersupport, charge, report, fuck, problem, service, and cancel. These are words to note when it comes to Uber’s service and customer experiences, as we will analyze in detail later in this paper.
All negative tweets:
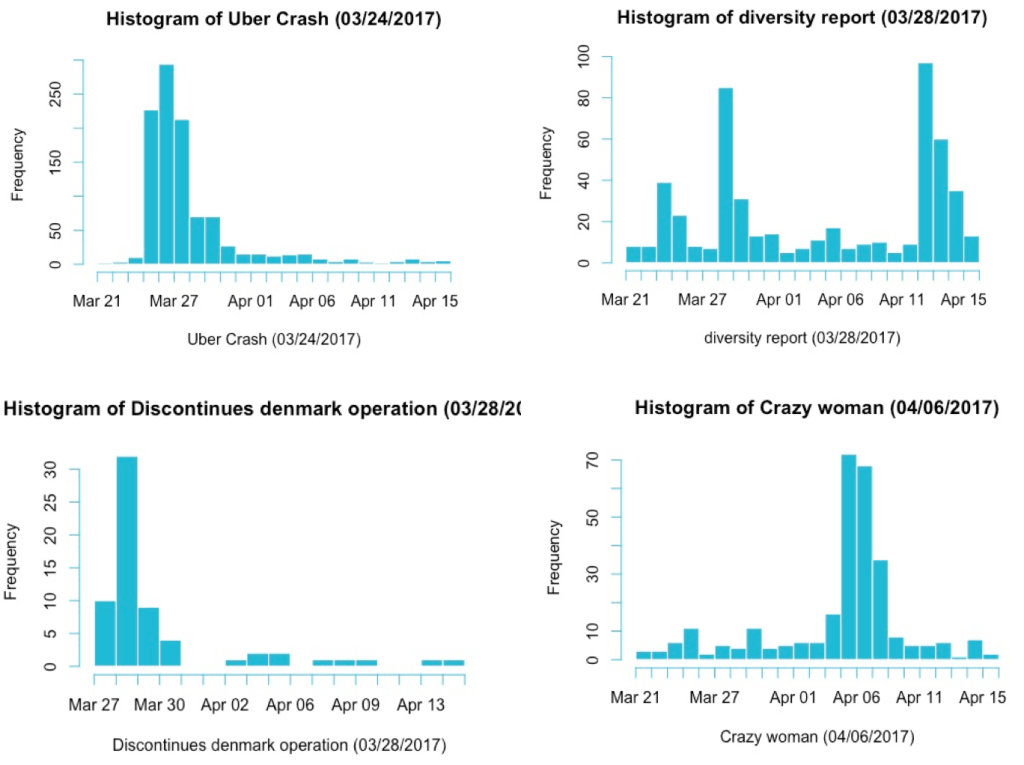
I collected Uber’s public twitter data from March 22st 2017 to April 16th 2017. Below is a histogram of the data collected, 1 bin represents one day. Therefore, we have 25 bins from March 22st to April 16th:
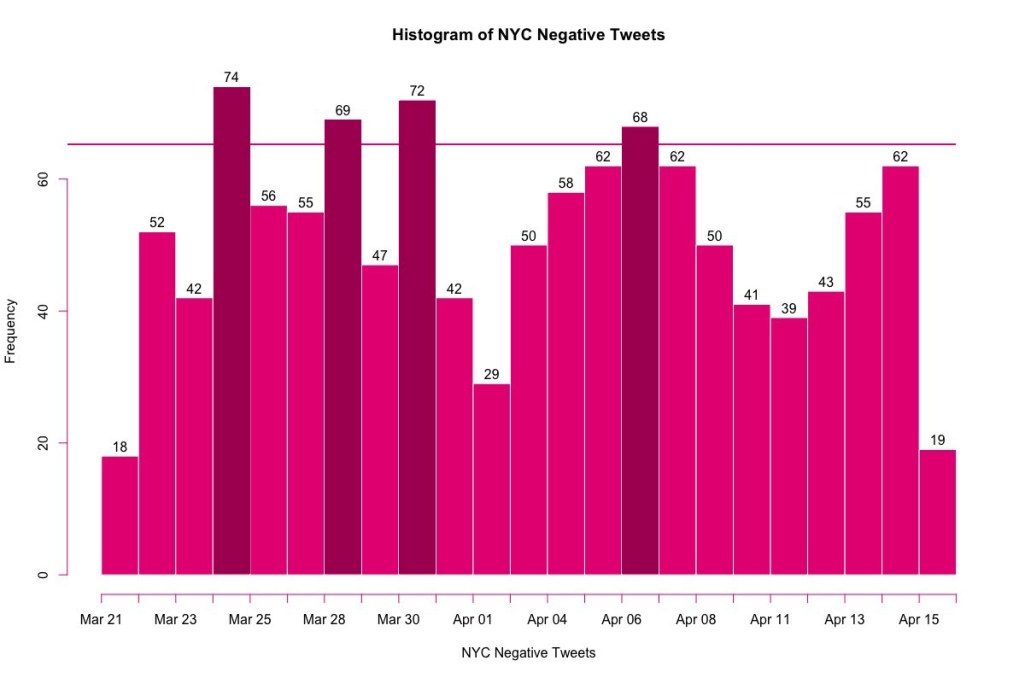
From the histogram above we can notice a few days when Uber had many negative tweets: March 25th, 28th, 30th and April 6th.
March 24th – an Uber car testing self-driving technology flipped onto its side in Tempe, Arizona, after being hit by another car. Thereafter, Uber suspended their self-driving car program in Arizona on the 25th. Clearly, the news made it to New York City where Uber followers (and potential customers) tweeted about the crash. From analyzing the tweets from March 25th, here are the main keywords tweeted that day in descending order based on frequency of appearance: Crash, driver, car, suspends, program. Since the Uber self-driving car crash took national news, New York City tweeters believe this was an important event since it was the most tweeted negative event from our histogram.
March 28th – Uber releases its first ever diversity report. 15% of Uber’s technical workers are women, the same as twitter and just under Facebook (17%) and Slack (24%). According to O’Brien, “Uber’s culture — and its treatment of female employees — has been in the spotlight after a former female engineer alleged sexism and harassment at the company last month” (O’Brien, 2017, para 3). Moreover, this prompted Uber’s CEO Travis Kalanick to call for an urgent investigation, which is expected to conclude at the end of April 2017. Finally, when it comes to ethnic diversity, Uber has zero technical leaders who are African American or Hispanic/Latino. That’s only bumped up slightly when looking at non-technical leadership positions: (3.7% are African American and 1.2% Hispanic/Latino). Therefore, causing negative sentiment on Twitter.
March 30th – New York lawmakers met to discuss state budget. This included an expansion of Uber upstate. Moreover, the bill included a possible 4% tax increase on rides. Additionally, Uber insures their drivers up to $150,000. Therefore, the bill will permit large cities to prevent companies like Uber from operating if they choose. My assessment would be that Uber customers would be opposed to this bill and have a negative sentiment towards it since paying more for their Uber rides would add up and be costly in the long run as possibility of tax increases come into play.
April 6th – By far was the most noticeable event when I researched the day on Uber’s news calendar. “The young Bronx woman who threatened to call police and falsely accuse an Uber driver of rape has been banned from the app for life, a spokesperson says” (Perez, 2017, para. 1). The female passenger accosted the male Uber driver for almost 9 minutes, Dash cam footage was released of this event. Additionally, not only did she threaten to report the driver for rape, the enraged woman was also caught on video saying she would punch herself in the face and tell cops he did it. Though this event had negative sentiment on Twitter, it was not targeted towards Uber specifically. It was negative sentiment against the woman who was accosting an ordinary responsible Uber driver.
March 25th, 28th, 30th and April 6th had high frequency of negative tweets. I compared these high frequency dates with news events about Uber. Moreover, to support to my analysis above here is a table with the top 5 frequency of words for each day.
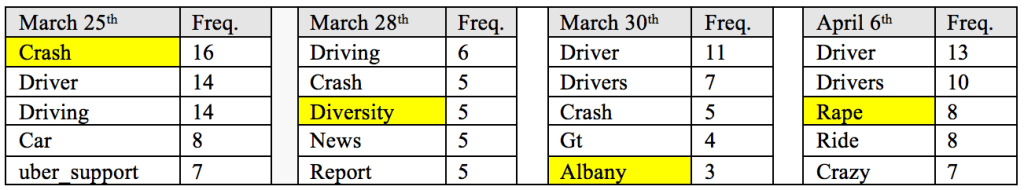
Moreover, lifecycle of frequency words by date:
However, notice that the keywords that are related to the news events are not the primary negative frequency word. The only case where this is true is March 25th. Even though we could extract a specific news event from each date with a high frequency of negative tweets, it seems that the ‘driver’ or ‘driving’ is still the primary concern with tweeters.
Next, we answer the question of who are the influencers in NYC. Below is a bar chart with users who were retweeted the most and had many favorited tweets:
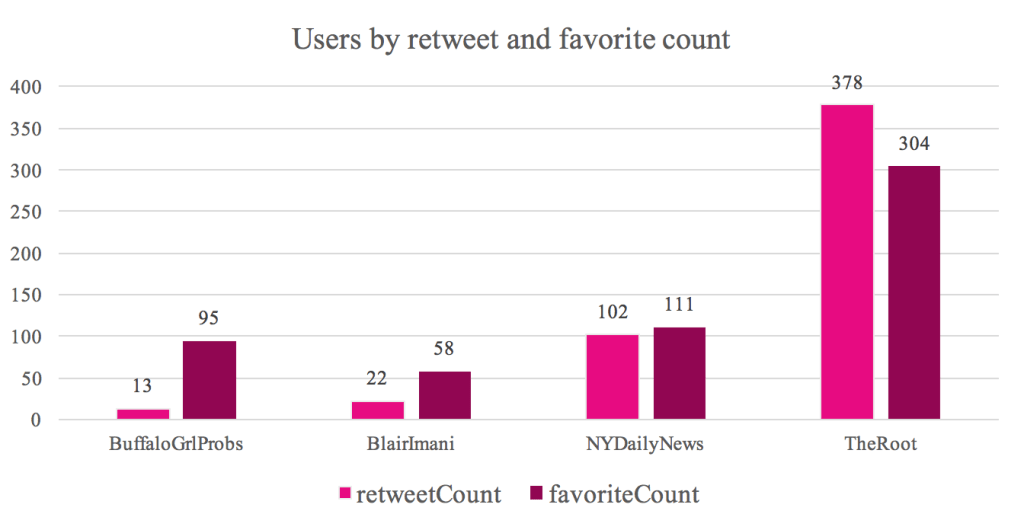
The biggest influencer in New York City is The Root. The Root is an American online magazine of African American culture launched on January 28, 2008 by Henry Louis Gates Jr. and Donald E. Graham. Their Twitter account has over 90,000 tweets and over 317,000 followers. Here is table with the tweets from TheRoot:
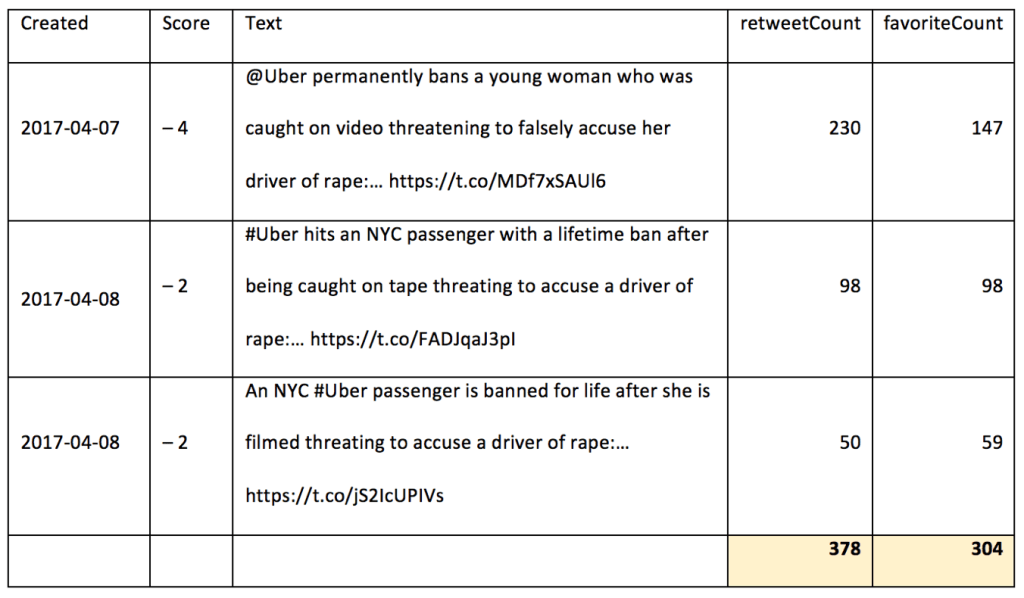
All three tweets are related to the April 6th event.
Next, we look at the relationship of the negative retweets and favorited tweets in New York City. After conducting a regression analysis with the sample size of 1,165, there is a positive correlation between retweet count and favorite count. Retweet count was utilized as the independent variable, with favorite count being the dependent variable:
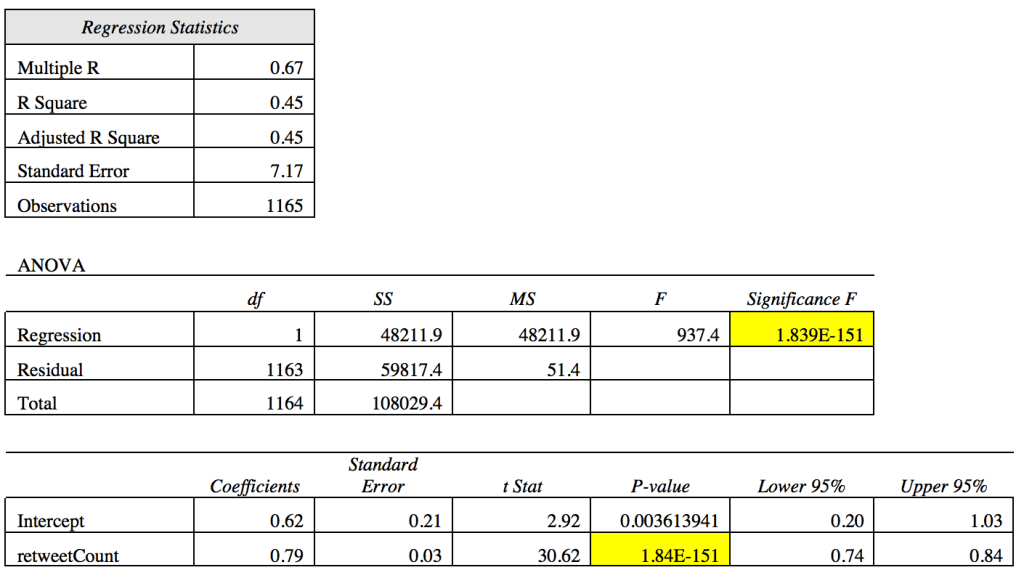
From our regression analysis, we can see that there is a positive correlation between retweetCount and FavoriteCount (67%). Therefore, as retweet count increases, favorite counts will also increase. The overall regression model was significant with, F (1, 1163) = 937.4, p < .001, R2 = .45. Moreover, our model indicates that retweet count is a good predictor of favorite count. Meaning 45% of the variation in favorite count can be explained by the retweet count. Furthermore, we can now use this model to predict favorite counts based on retweet counts. For example, if a tweet is retweeted 108 times, what is the probable favorite count? We can identity the favoriteCount by using the regression equation:
Y = a + bx
FavoriteCount = 0.62 + .79(108) = 85.94
Therefore, we can conclude that if a tweet is retweeted 108 times, it will be favorited 86 times.
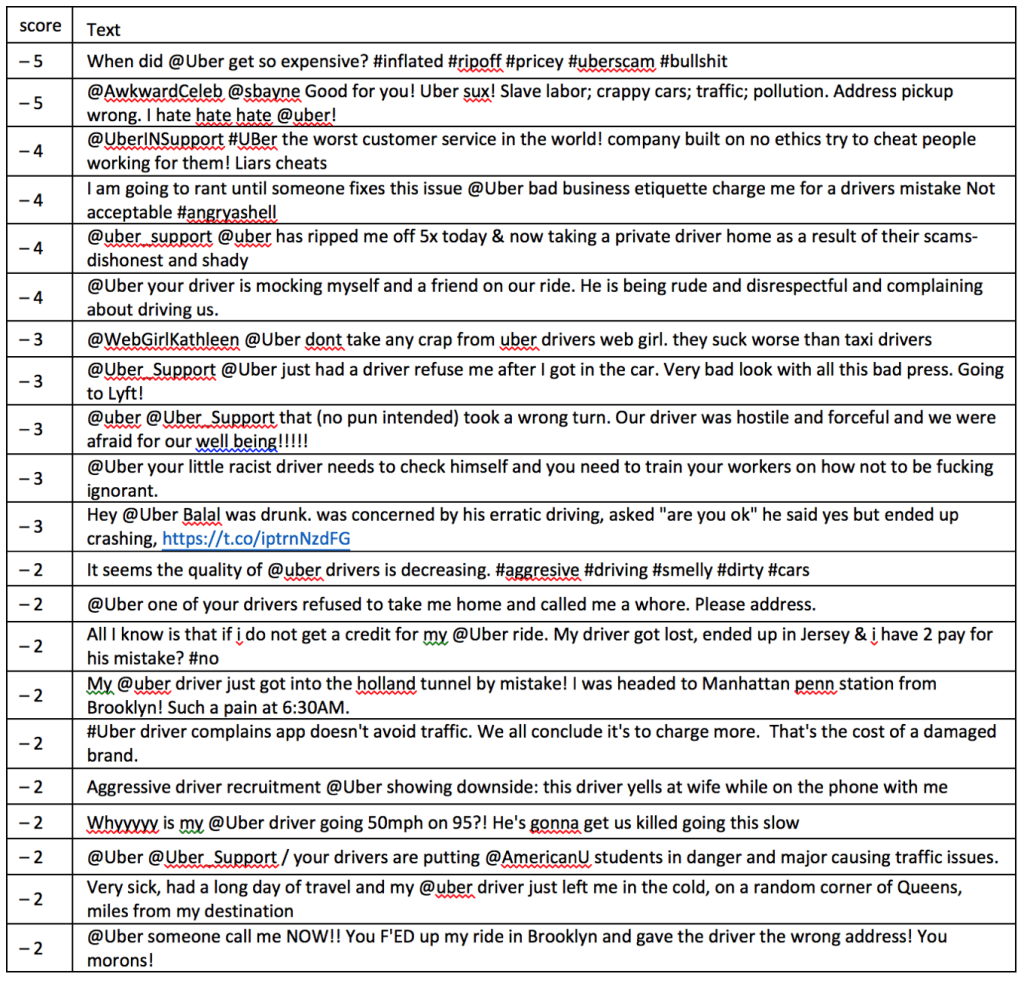
Finally, we look at the negative tweets with the lowest score. Aside from all the news events Uber faced, customers also seem to be having issues with drivers, prices and Uber’s transaction system:
Conclusion
In conclusion, from all data collected there was a small percentage of negative tweets from New York City (0.85%). Negative tweets had an average score of –1.354. I discovered that the biggest influencer was TheRoot, an online magazine. Also, there was a correlation between retweet count and favorite count. Retweet count can explain 45% of the favorite count. The majority of negative tweets gathered were relate news events. Therefore, more difficult to dissect what issues New York City customers are uniquely facing when it comes to negative sentiment towards Uber’s services. News events are national and maybe global. Therefore, not unique to our geographic area of interest. However, clearly displayed in the WordCloud and frequency of most used words in the negative NYC tweets, I discovered the high frequency words of ‘driver’ and ‘driving’. In addition, in the last portion of the analysis I discovered customer’s frustrations with Uber drivers.
Recommendation
Aside from the recommendation to stay out of major PR disaster like the ones Uber is constantly facing, I would recommend a marketing strategy advertise Lyft drivers. In the last portion of our data analysis I discovered that customers were facing very difficult issues with Uber drivers. Therefore, the recommendation is to advertise Lyft’s driver’s and their friendliness with customers in New York City would be taken well. When it comes to transportations services I believe the driver is the most important aspect of providing good experiences for customers. Drivers have the responsibility to understand the customer and how they should interact with them. Customers can be busy people not wanting to be disturbed during their ride or then can be talkative and wanting to interact with someone. This responsibility should be left to the driver to determine what type of customers they have and act appropriately.
Additionally, advertising of the Lyft hiring vetting process could also prove successful in New York City. Especially with the customers who had difficulty with drivers. If potential customers can understand that Lyft doesn’t just hire anybody, but good quality drivers it can bring frustrated Uber customers to Lyft services. “…some Uber drivers in major cities like NYC work 19 hours in a day” (Bliss, 2016, para. 10). This is a good explanation why some drivers get easily frustrated with customers. They are tired and at times sleep deprived. Therefore, short tempered. Lyft should take advantage of Uber’s bad drivers in NYC. In comparison to Uber, “With Lyft, every 14 hours you’re in driver mode requires you to take six hours off” (Bliss, 2016, para. 9). Clearly, this can result in more well-rested drivers. Therefore, friendly drivers.
Finally, my strongest recommendation would be to send reconciliation tweets to users who experience bad events with Uber. Most importantly, we can set up automated algorithms, which can send coupons or $5 off to tweets with a negative sentiment value equal to or below -3 containing strings such as “going to Lyft”, “switch to Lyft” or any other keywords indicating that customers want to make a just over to Lyft from Uber.
Reference
Bliss, Jeanne. (2016). Why You Should Love Lyft More Than Uber. Customer Bliss. Retrieved from: http://www.customerbliss.com/love-lyft-uber/
Bing Liu, Minqing Hu and Junsheng Cheng. “Opinion Observer: Analyzing and Comparing Opinions on the Web.” Proceedings of the 14th International World Wide Web conference (WWW-2005), May 10-14,
2005, Chiba, Japan. McKinley, Jesse. (2017). In Albany, Glimpses of Budget as Federal Cuts and Deadlines Loom.
The New York Times. Retrieved from: https://www.nytimes.com/2017/03/30/nyregion/federal-cuts-new-york-state-budget-andrew-m-cuomo.html?_r=0
Minqing Hu and Bing Liu. “Mining and Summarizing Customer Reviews.” Proceedings of the ACM SIGKDD International Conference on Knowledge Discovery and Data Mining (KDD-2004), Aug 22-25, 2004, Seattle, Washington, USA,
O’Brien, Sara A. (2017). Amid Turmoil, Uber releases first diversity report. CNN. Retrieved from: http://money.cnn.com/2017/03/28/technology/uber-diversity-report/
Perez, Chris. (2017). Uber bans rider for life over threat to accuse driver of rape. New York Post. Retrieved from: http://nypost.com/2017/04/06/uber-bans-rider-for-life-over-threat-to-accuse-driver-of-rape/
Reuters. (2017). Uber suspends self-driving car program after Arizona crash. CNBC. Retrieved from: http://www.cnbc.com/2017/03/26/uber-self-driving-car-arizona-crash-suspended.html