“Insurance is a product that both the seller and buyer hope is never actually used” (Author Unknown) is a revealing statement about the insurance industry, where both sellers and buyers approach with caution. Insurance companies want to maximize premium profits with as little risk as possible. In this essay, I will explore how GIS (Geographic Information Systems) play a key role in the insurance industry. First, I will talk about how insurance companies can utilize GIS for risk analytics and leveraging risk. Second, I will explore natural disasters and how insurance companies can quickly respond to events, determine claim costs and notify policyholders. Finally, I will discuss a more commonly use of GIS in real estate insurance. With home buyers swarming the market after the 2008 housing collapse, home insurance companies are back at quickly estimating and determining insurance premiums.
Risk Analytics
The primary objective for insurance companies is to eliminate risk and have a clear picture of all variables involved in making a decision. The more data an insurance company can obtain, the more choices and opportunities will be presented. From automobile insurance to home insurance, data is the key to forecasting events, “These include such information as proximity to hazards and emergency services, traffic patterns, commute routes, assets and crime” (Richardson 2011, para 1). Richardson brings up traffic patterns, which clearly affect automotive insurance companies.
By analyzing traffic patterns and flows, auto insurance companies can make better decisions when providing policies to customers. A specific method to determine traffic congestions and heavy traffic areas are heat maps. A heat map is a graphical representation of data where the individual values are represented as colors, which is then overlaid on a map. Automotive insurance companies will also have a more detailed report from a number of cars in the congested areas per day, to the time there is no traffic. All of this data can help insurance companies make informed decisions on premiums. For example, an insurance company may charge a larger premium to someone living in Los Angeles, which has a population of about 4 million people. In contrast, the premium for the same coverage can be substantially low for someone residing in Coachella, CA, the population of 45 thousand. There are fewer cars on the road in Coachella. Therefore, the chances of an accident are reduced. All this information can be visualized on a map and analyzed to minimize risk. Heat maps based on traffic patterns are just one component of GIS in the automobile insurance industry. There are many other components that play a role, such as demographics, driving distances (home to work), weather conditions, driver’s age, years of driving experience, etc. Below is an example of a heat map displaying heavy traffic areas in a city.
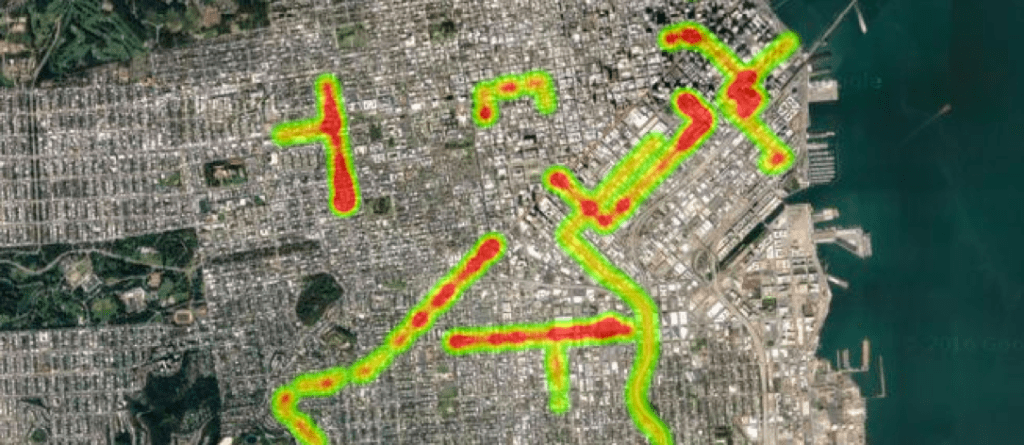 Google developers – Heatmaps example https://developers.google.com/maps/documentation/javascript/examples/layer-heatmap
Natural Disasters
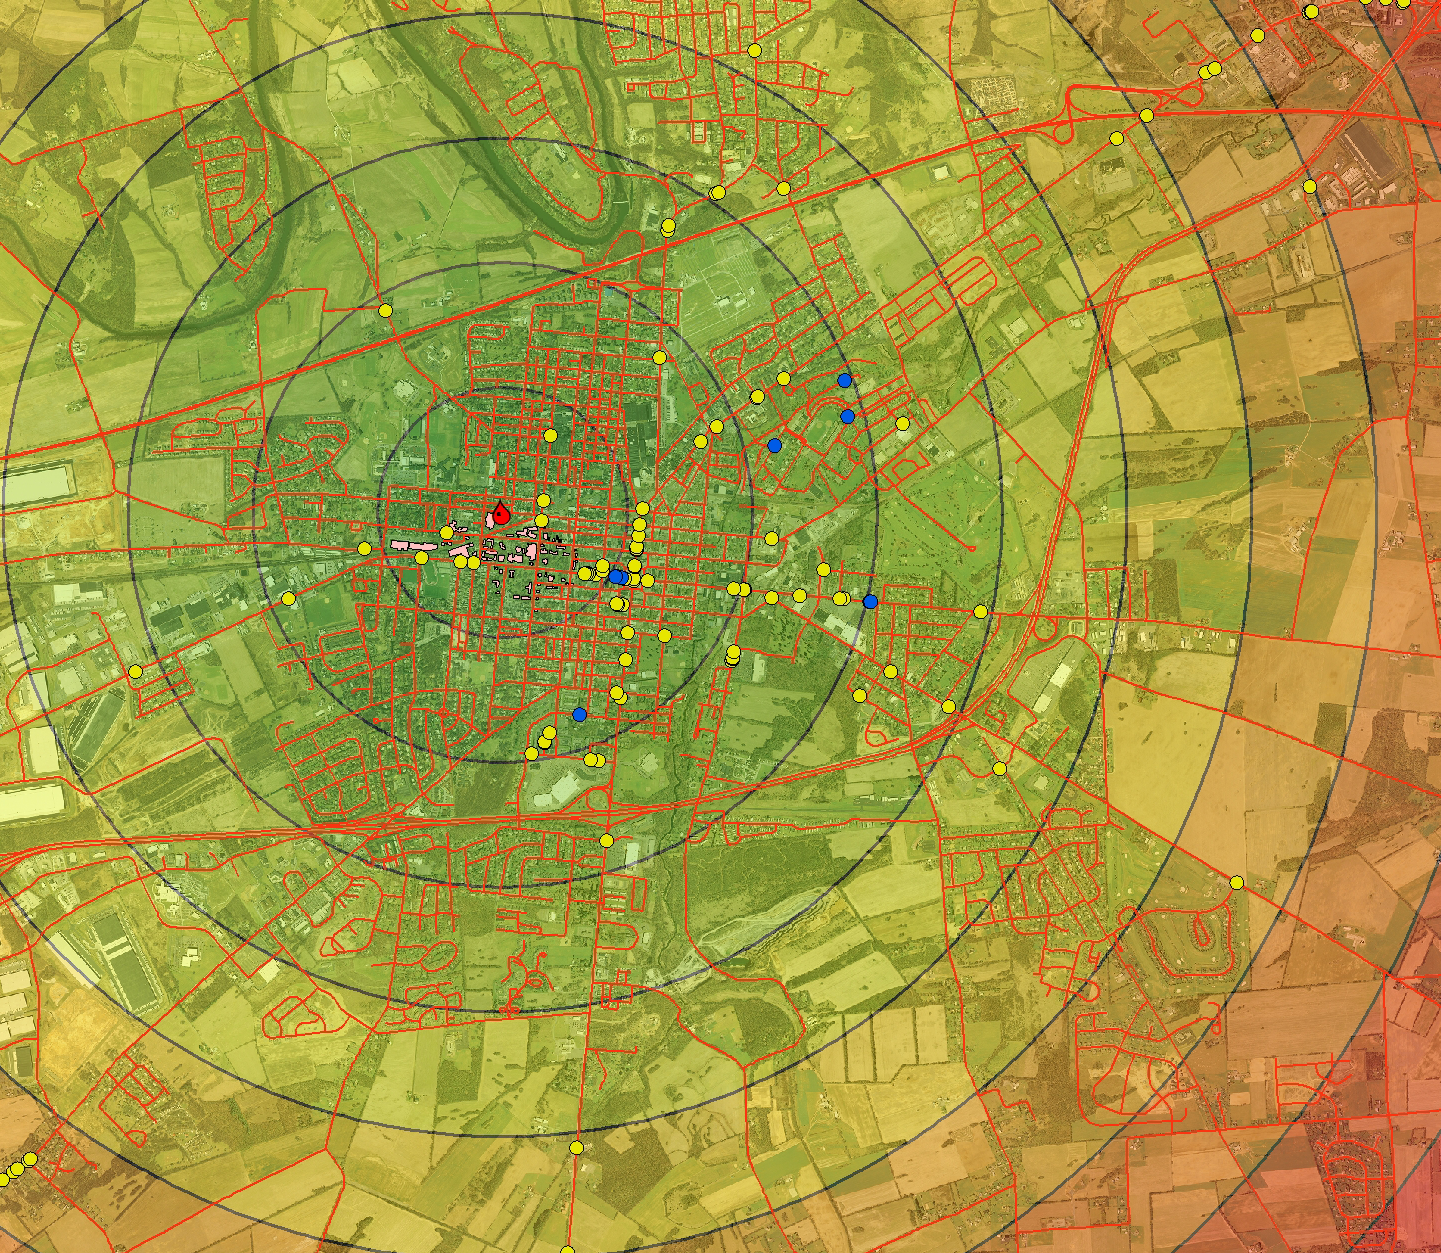
“According to a global insurance study, worldwide economic losses from natural disasters in 2010 totaled $194 billion. Disasters can damage infrastructure, interrupt production and significantly impact private sector’s financial performance.” (Groenfeldt, 2012, p. 2. Para. 6). Natural Disasters are mainly unavoidable. Esri (Environmental Systems Research Institute) – the largest GIS software company – helps insurance companies manage risk. During my research, I found an Esri developed an application that helps insurance companies with risk management (Insurance Risk Management Demo: http://webapps cdn.esri.com/Apps/StepByStep/). Using the scenario of a hurricane approaching southern Florida I will demonstrate how the application works. Let’s assume that an insurance company has many policyholders. With Esri’s risk management app, the first step is to visualize all their policyholders on a map. Second, find where the majority concentration of policyholders reside. Third, the insurance company can now display where the highest valued homes are. Fourth, overlay the areas the hurricane will affect the most with different colors representing different intensities. Finally, the insurance company can estimate which homes will be affected by the hurricane and what the potential claim value will be. They can also inform their at-risk policyholders to help protect their family and property. In this example, the insurance company will notify all policyholder which will be in an area that will have more than 3ft of water, due to a hurricane.
Hurricane example visualization:
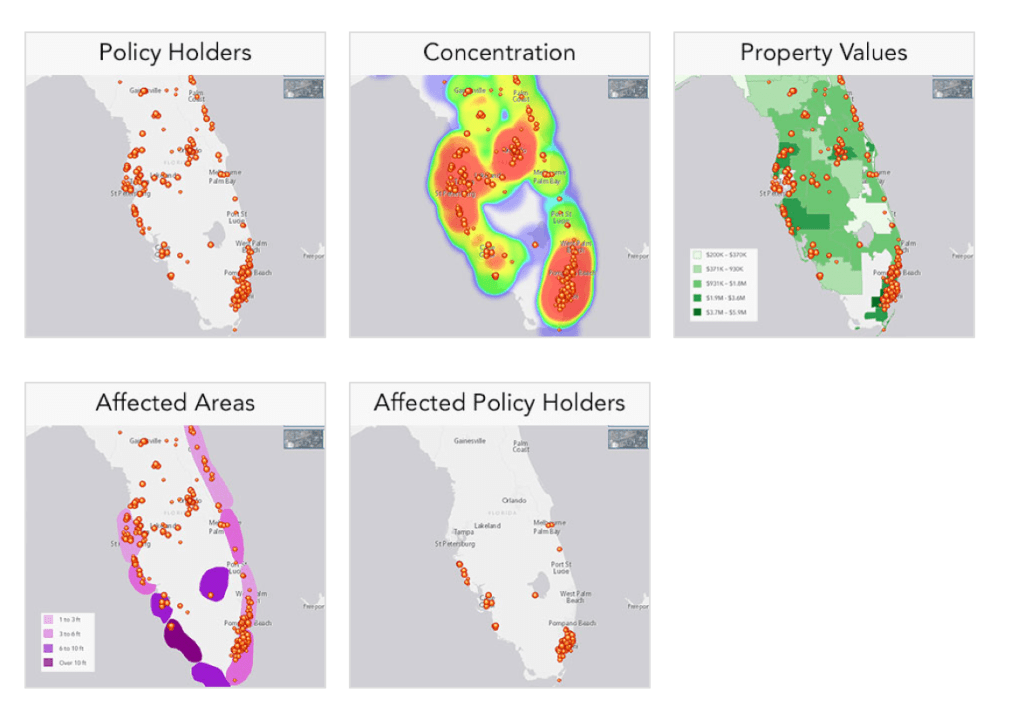
Insurance Risk Management Demo http://webapps-cdn.esri.com/Apps/StepByStep/
Insurance Risk Management tools are critical in the insurance industry, as they can provide accurate estimates of property damages and claims. It is also a good tool to keep track of where all the policyholders reside relative to each other, and where there is a large concentration of risk. As technology continues to evolve and raw data is appended as variables to processes, the more accurate predictions and forecasts will become, making the decision-making process easier and creating more precise insurance premium estimates.
Purchasing Home Insurance
“Where” is the popular word in GIS, identifying all relevant information of a specific geographic location. When home insurance companies are assessing premiums, it is critical for them to understand the context of the geographic location of the customer. Some of the variables that come into play during the assessment process are hazardous zones: earthquakes, floods, volcanic, hurricanes, tornadoes, fires, etc. For example, areas that are more prone to hurricanes and floods will have a much higher insurance premium than locations that are not. Alongside with other factors: location demographics, crime rates, population density, etc. – there are just a few geographic components that affect insurance premiums and decisions about ensuring customers. Rightfully so, if a high risk for claims exists, premiums would be higher. GIS enables insurance companies to take this analysis and better serve their customers. Below is an example of historical earthquakes in California, which evokes higher insurance premiums for earthquake insurance.
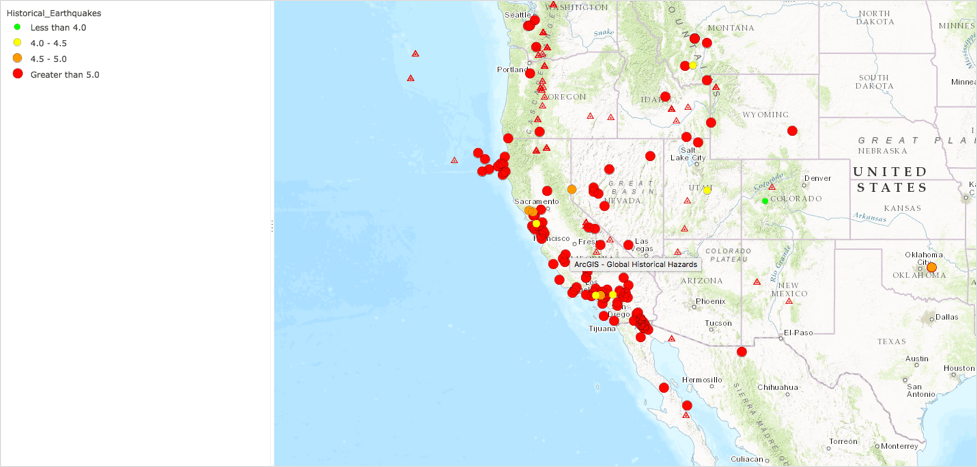
Global Historical Hazards (Pacific Disaster Center) http://www.arcgis.com/home/item.html?id=0fa97960564248288ad121a00f77cc57
Summary
GIS is essential and a critical component for insurance companies, since they do depend much on location and location analytics. GIS enables insurance companies to make informed decisions and properly assess, maintain, manage, monitor, forecast and predict events which affect them directly and their customers.
In this essay, I reviewed how insurance companies analyze risk and leverage it to make decisions. Next, I discussed the effects of natural disasters and how insurance companies utilize GIS to respond to events such as hurricanes. Finally, I reviewed the process of insurance companies utilizing GIS when ensuring homeowners and all the array of variables that are involved.
References
Environmental Systems Research Institute (Esri). Insurance Industry. Retrieved From: http://www.esri.com/industries/insurance
Environmental Systems Research Institute. Insurance Risk Management Demo. Retrieved from: http://webapps-cdn.esri.com/Apps/StepByStep/
Groenfeldt, Tom. (2012). Zurich Insures Supplier Risk As Climate Change Increases Natural Disasters. Forbes. Retrieved from: http://www.forbes.com/sites/tomgroenfeldt/2012/05/10/zurich-insures-supplier-risk-as-climate-change-increases-natural-disasters/#590df4014ce0
Richardson, Karen. (2011). Insurer Uses GIS for More Accurate Risk Analysis. Directions Magazine. Retrieved from: http://www.directionsmag.com/entry/insurer-uses-gis-for-more-accurate-risk-analysis/180325